
As the post-portem of the US presidential election continues, an easy target of criticism has been ‘the polls’ – and the entire polling industry. It’s tempting to join in. In today’s Daily Telegraph, Timothy Stanley lambasts pollsters for their failure to predict President Trump and boldly declares, “Data is out. Emotion is in.”
I find this criticism far too simplistic, for three reasons. First, by and large, the national polls have proven to be fairly accurate. Second, the election result essentially hinged on surprises in three states, but taking a closer look at polling data from each of them would have made these results less surprising. Finally, there is a bigger issue. It’s not just polling methods that require scrutiny; it’s also about how we choose to interpret what polls tell us.
Let’s start with the national picture. The graph below presents the results of all major national polls published in the month before Election Day (the trends have been ‘smoothed out’ by taking rolling averages). Two things should jump out straight away. The first is that throughout the final weeks of the campaign, national polls pointed to a pretty close race.
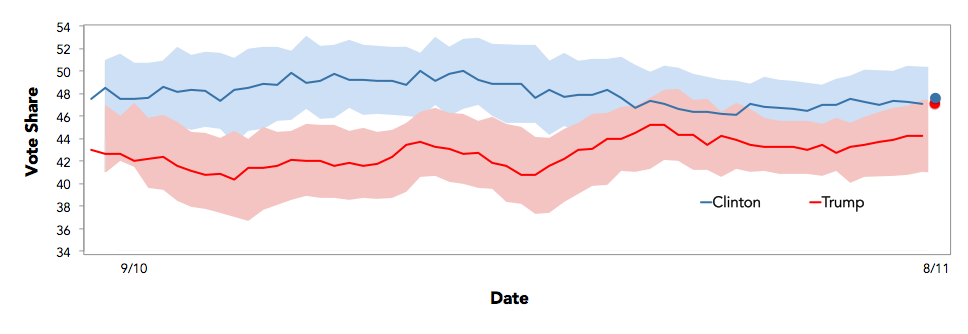
To really appreciate the closeness of the race, ignore the blue line (Clinton’s level of support) and the red line (Trump’s level of support), and instead look at the blue and red shaded areas on either side of the two lines. This shaded area is called the ‘margin of error’. No poll claims to be precisely accurate, but it does claim to be statistically accurate within a calculated margin, typically plus or minus three percentage points of the headline figures. Glancing at the graph, the statistical evidence is fairly clear. In the closing fortnight of the campaign, the difference between levels of support for Clinton and Trump was within the margin of error. In other words, it was a close contest.
The other striking feature of the graph is that, ultimately, national polling averages did foresee the final outcome (the blue and red dots at the far right). With some final results still to be declared, Clinton leads Trump in the national popular vote by a margin of 48% to 47%. This is a close margin (just as the polls predicted), but the polls did still manage to get the order correct: that Clinton received more votes than Trump across the country as a whole.
Now, let’s turn to the states that decided the race. In most of the crucial battleground states, polling averages pointed to a dead heat between Trump and Clinton, usually with Trump narrowly ahead. This was the case in Florida, North Carolina, and Iowa. In Ohio, Trump’s larger lead had been outside of the margin of error for some time; this was reflected in the final polling averages.
Similarly, let’s not forget that Hillary Clinton performed well in other battleground states – and so did the polls in these states. In Colorado, the final polling averages suggested that she was ahead by 2.9 percent. She won by 2.9 percent. In Virginia, the final polling averages suggested that she was ahead by 5.0 percent. She won by 4.9 percent.
So where did the polls perform less well? They had a tougher time in the states where Clinton’s strategy also happened to go badly wrong. But they still shouldn’t have meant that Trump’s victory was a total surprise.
In Pennsylvania, the final polling average put Clinton just 1.9 percent ahead (therefore, within the margin of error). One poll in the final week put Trump 1 percent ahead. He won the state by 1.2 percent. In Michigan, the polls were further out, suggesting Clinton was about 3.4 percent ahead, but she is losing by 0.3 percent (Michigan still hasn’t officially declared its results yet). At the same time, it should be noted that one poll by the Trafalgar Group did estimate Trump ahead by 2 percent on the eve of the election. In other words, the evidence wasn’t conclusive. Indeed, it’s precisely why an alarmed Clinton campaign hastily flew their candidate to Michigan on the day before the election.
Wisconsin was perhaps the biggest upset. Seen as a more reliably Blue state, the final polling average had Clinton on course for a 6.5 percent margin of victory. In this state, no poll had Trump ahead but, of course, he edged past Clinton by 1.0 percent to take the state’s 10 electoral votes – and the presidency.
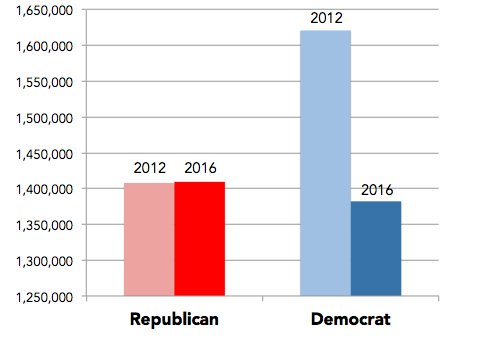
The story in Wisconsin is an important one. Here, it’s less that Trump did better than Mitt Romney in 2012, and much more that Clinton did worse than Obama. Look at the raw votes for each candidate in the chart above: Trump secured 1,500 more votes than Romney, whereas the Democratic vote fell by 239,000. The polls did not directly capture this vote collapse, but they did indirectly show that there was a big difference in the levels of enthusiasm between Clinton supporters and Trump’s. On Election Day in Wisconsin and these other industrial states of the Midwest, voters who leaned towards Clinton didn’t ultimately feel strongly enough to turn out and cast a ballot for her.
Finally, taken together, this means that we need to be much more critical of the way in which polls are reported and the way in which we interpret them. We shouldn’t take them at face value. We should appreciate the statistics behind them: that their headline figures are always associated with a margin of error. We should also look beyond these headline figures to other metrics, most notably how enthusiastic a respondent is about his or her preferred candidate.
It’s true, polls are far from perfect. It is possible that there are still some deeper, more systematic problems that require much more attention. Does it matter if they are conducted over the phone or over the Internet? Do they reach groups that are historically ‘hard-to-reach’, like Hispanics and younger voters? And just how much do they underestimate or overestimate how likely someone is to ultimately turn out to vote?
The polling industry must invest a lot of time reflecting on these questions and others. In the meantime, however, let’s not buy into the narrative that the polls got it all wrong. They were much more right than wrong. Any poll can only ever be as good as its interpretation allows.
When I started watching the results trickle in during the early hours of Wednesday morning, I was quietly confident that Clinton would emerge as America’s 45th president. That nervous confidence was largely in spite of the polls, not because of them. Perhaps if I hadn’t interpreted them with my own unfounded optimism, I wouldn’t have been so stunned later in the morning.